
In today’s data-driven world, having access to valuable insights about how your customers interact with your content can be a game-changer. Emma, our Head of Product Marketing, recently hosted a webinar to introduce Touch Stay’s powerful new feature - Data Dashboard.
Data Dashboard gives users a comprehensive view of how your audience engages with your guides. During the webinar, Emma covered the key features of the Data Dashboard and how you can leverage these insights to enhance your guides, improve your business, and deliver an exceptional customer experience.
Watch the Data Dashboard webinar here, or read on for key takeaways:
Timestamped insights
02:20 👀 Guidebook views are crucial: understand why your audience is or isn’t finding your guide, and take steps to increase guide views by sending the link through various channels.
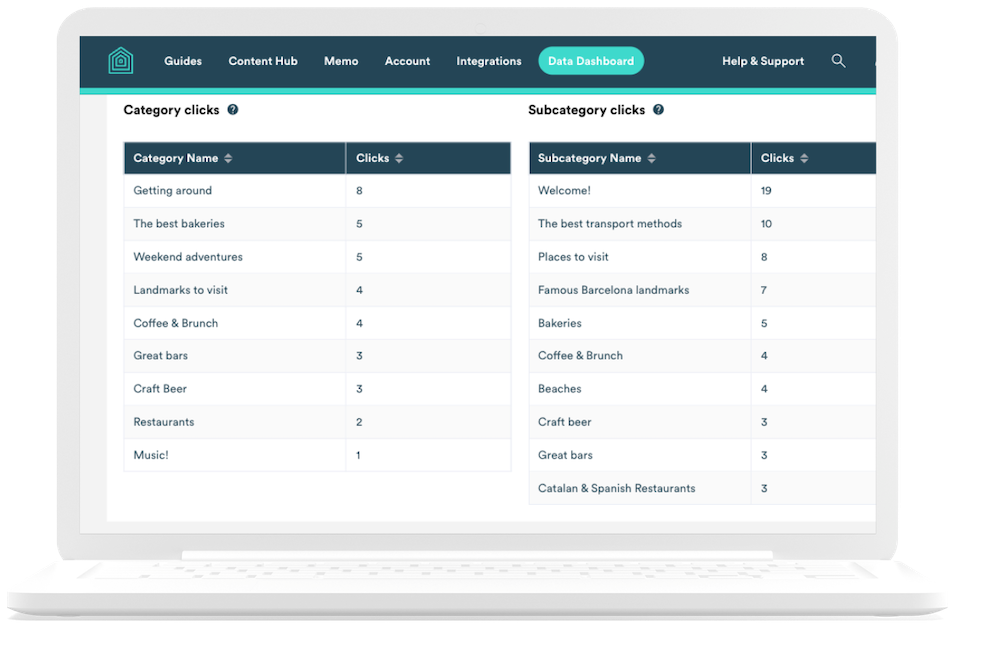
21:24 🔍 Analyse Category/Subcategory clicks: Low clicks on important Categories? Use Deep Links to send specific content directly to your audience and highlight the search function for self-service.
25:15 👂 Gather feedback effectively: enable the First Impressions Topic and guidebook feedback pop-up to collect real-time sentiment from your audience, allowing you to address concerns quickly.
29:13 ✨ Leverage Custom Elements: explore the power of Custom Elements like forms, playlists and 3D tours to create a richer, more immersive experience within your guides.
45:13 🎞️ Go beyond text: if your guides are too text-heavy, incorporate visuals, videos and interactive elements to enhance engagement.
Understanding the Data Dashboard
The Data Dashboard is a centralised hub that provides you with a wealth of information about your guide views, unique visitors, Category and Subcategory clicks, and audience feedback over specific time periods, including custom ranges. With these key metrics at your fingertips, you can make informed decisions about how to optimise your guides and ensure that your content is resonating with your audience. All data is refreshed every five minutes, providing you with near real-time updates.
Key features of the Data Dashboard:
- Guide views over time
- Category and Subcategory clicks
- First Impressions feedback
- Guide feedback pop-up ratings

Actionable insights to improve your guides
The Data Dashboard offers a wealth of actionable insights that can help you take your guides to the next level. Here are some key strategies you can implement based on the data:
Increase guide views
- Send the guide link at least three times throughout the customer journey (post-booking, mid-way before arrival, and just before arrival)
- Leverage multiple communication channels, including Memo, email, text, OTA portals, and PMS inboxes
- Use QR codes around your property to encourage guide access
Boost Category and Subcategory clicks
- Analyse clicks to identify popular and underperforming content
- Use Deep Links to send specific content to your audience, such as door lock codes, check-in instructions, and Wi-Fi password
- Highlight the search function in the guidebook to help guests find information easily
Gather valuable feedback
- Enable the First Impressions Topic to collect real-time feedback from guests
- Monitor the guide feedback pop-up ratings to understand audience sentiment
- Email Capture can be enabled as a Special Topic to collect guest email addresses and build a longer-term relationship
Enhancing your guides with Custom Elements
One of Touch Stay’s most exciting features is the ability to customise your guides by embedding Custom Elements. These third party integrations are free and easy to use, help you create a more engaging and interactive experience for your audience, provide additional value to guests, and generate more revenue for hosts. Some examples of Custom Elements include:
- AllTrails walking tours
- Jotform surveys and forms
- Spotify playlists
- Matterport 3D virtual tours
By incorporating Custom Elements, you can provide the audience with a richer, more immersive experience, increasing their engagement and satisfaction with your guides.
Learn more about the Data Dashboard here.
Start a 14-day free trial to explore your own Data Dashboard and unlock the full potential of your Touch Stay digital guidebooks.